Archive for May 2009

Taking a look at Illinois

May 28, 2009

Let’s look at another state that offers some different features than Pennsylvania and Idaho did. Illinois is made up of regions that are run by universities  and operate almost as mini-state programs in many ways.

Training began in 1976 with 200 students and in 33 years, a total of 243,155  riders have taken basic training. In 1996, a total of 130,753 had already been trained. Iow, we know from Illinois what we didn’t know in Pennsylvania. However, I’ll figure it just as I did for PA—as if no one had been trained prior to 1997. And then, just because we can, we’ll figure the aggregate with the total numbers of basic trained students.

Illinois, too, switched over to the BRC but in 2002, but Illinois is also the only state that has field-tested TEAM Oregon’s curriculum for two years in two regions and an additional year in one of those two regions.

It’s a free state and only had a helmet law from 1967-1969 meaning there would be no sudden effect on fatalities as was possible in Pennsylvania.

From 1997-2007, in Illinois:

MC Fatalities increased 96.34%

Training increased by 110.6%

Registration increased 81.7%

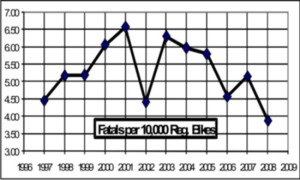
However, a former ILDOT administrator and current instructor in the UIUC region, Dave Taylor, prepared the following two graphs that were handed out at the spring Update:
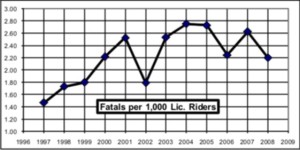
IL fatalities per 1,000 lic riders

IL fatalities per 10k regs

John Sudlow, UIUC region project coordinator suggested that it appears that fatalities are no longer rising. While that would be good news, they are still considerably higher than they were back in 1997 per licensed rider—though not per 10,000 registered motorcycles. It should also be pointed out that it’s unknown whether Illinois includes off-road motorcycles in the total motorcycle registrations and what effect that would have on the registrations.

As illuminating as Mr. Taylor’s graphs are, we’ll go back to the apples to apples approach and look at Illinois as we did Idaho and Pennsylvania:

Training

Training in Illinois as in the other two states showed a very strong upward trend over the 11 years.

Illinois was one of the first states to have an extensive motorcycle training program, developed two of the curriculums that MSF used as a basis for its curriculum and was one of the first states to sign a Rider Education Recognition Program contract with MSF. Illinois changed to the Basic RiderCourse in 2002.

  • A total of 243,155 students have completed basic training from 1976-2007.
  • Almost half of them (46%) were trained in that 11-year time span.
  • 65% of those trained from 1997 were trained with curriculum based on student-centered, adult-learning principles.

Until recently, ILDOT counted students as “dropped” if they left the course before they completed 50% of the course. “Did not Graduate” however, has the net result which allows comparison between Idaho and Pennsylvania.

Year

MC Fatalities

Total Students

Passed

Failed

Dropped

Did not graduate

1997

82

6,658

85.62%

N/A

N/A

14.38%

1998

97

7,311

80.30%

12.40%

4.50%

16.90%

1999

103

7,383

79.70%

15.10%

5.10%

20.20%

2000

128

8,458

81.40%

14.20%

4.40%

18.60%

2001

138

9,273

81.40%

13.60%

5.00%

18.60%

2002

103

10,052

82.60%

12.20%

5.20%

17.40%

2003

140

10,943

84.70%

10.30%

4.90%

15.20%

2004

161

11,828

84.80%

10.50%

5.00%

15.50%

2005

159

13,155

88.80%

11.90%

5.10%

17.00%

2006

133

13,007

80.90%

13.80%

5.30%

19.10%

2007

161

14,022

77.90%

16.10%

6.00%

22.10%

In the first years after the BRC began to be taught, the fail rate fell and the pass rate rose while the dropped rate stayed approximately the same. In this way, there’s a similar pattern in Illinois as we saw in Pennsylvania rather than what we saw in Idaho—but there’s not a huge difference in the percentages.

Does motorcycle registration explain the increase in fatalities?

Fatalities v. Motorcycle Registrations
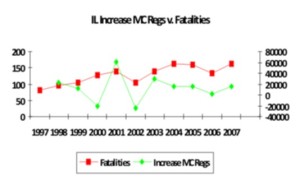
IL Inc MC regs v fatalities

Motorcycle registration alone did not explain the increase in fatalities in either Idaho nor Pennsylvania—but does it do so in Illinois?

Of note is the difference between the rate of fatalities by motorcycle registration and licensed rider and the raw number of fatalities v. the number of motorcycle registrations. It also appears Mr. Taylor used different figures than the ones available on the FHWA website. I am constrained to use FHWA stats to keep apples to apples with the other states we’re looking at, however the numbers are fairly close.

Looking at Illinois as we did Idaho and Pennsylvania, then, fatalities have leveled off, which isn’t as good of news but it’s better than if they were still rising.

However—as in the previous states—there doesn’t appear to be a strong correlation between increased fatalities and increased motorcycle registrations, which is what NHTSA has been saying for a number of years now though motorcyclists have continued to reject that notion.

Also of note is that, in all three states, motorcycle registration has gone up and down with greater or lesser swings while fatalities have also varied, the variations are far less pronounced.

Training and registrations

If we look at the increase in motorcycle registrations compared to the number of students who took basic training, in three of the four years, far more students took the course than additional motorcycles were registered and in an additional five years, there’s a significant overlap of students and registrations ranging from 59%-94%. Only in three of the 11 years were there a far greater increase in registrations than there were in students trained.

Year

MC Reg Increase

Total Students

1997

10,708

6,658

1998

22,445

7,311

1999

12,424

7,383

2000

-21,122

8,458

2001

61,330

9,273

2002

-23,641

10,052

2003

28,856

10,943

2004

15,089

11,828

2005

14,971

13,155

2006

1,963

13,007

2007

14,960

14,022

As we know, some graduate training and do not ride, others fail and go on to get licensed anyhow or ride without licenses or are licensed without training and motorcyclists often own more than one bike. Even so, the aggregate number of students who have competed the course from 1976-2007 is 243,155 is just 30% less than the total motorcycle registrations in 2007.

This is the third state where we found what might be a correlation between training and motorcycle registrations.

If we apply MIC’s owner formula (1.5 motorcycles per owner) there’s more trained riders (243,155) at the end of this 11-year period than there were owners (231,533). This is the third state that we’ve seen trained students compared to owners or motorcycles are much closer than we’ve been led to believe they were. Common thinking—that most riders don’t take training—may not be true.

Once again, though, we have no idea how many fatalities have taken training in Illinois or somewhere else and we know there’s untrained riders on the road.

Still, as we’ll get to in a future entry—what it means that training numbers correspond more closely to the increase in motorcycle registration than fatalities do has critical implications.

Was one year a watershed?

2002 marks the halfway point between 1997 and 2007. It was also the year Illinois switched to the BRC:

In this subdivision of the relevant time:

  • 65% of all the students trained in the relevant time period took training since then,  and
  • just under 50% of the increase in motorcycle registration occurred since 2002,
  • But 75% of the fatalities occurred.

Which is not to say there are connections. But let’s look closer at training and fatalities:

Training and fatalities

Unlike Idaho, we don’t know how many trained students have died in motorcycle crashes.

However, unlike in Pennsylvania, we do know how many students have been cumulatively trained in Illinois. However to keep apples to apples, here’s the same comparison we did in other states—how many were training from 1997-2007: IL 11 year total training v fatalities
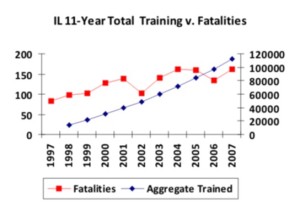
However, because we do know exactly how many have been trained since the beginning of the program—as we did in Idaho—we’ll look at the aggregate trained v. fatalities:
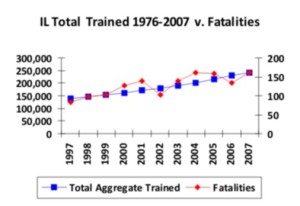
IL 1976 2007 total trained v fatalities

Does this mean that training ultimately have no effect on fatalities—that Billheimer was right and absolutely all benefits from training is gone by the end of a year? Or does it just mean that training went up at about the same rate as fatalities but that’s just a coincidence?  Or does it mean something else or nothing at all? I don’t know.

However, there is a difference when it comes to Did Not Graduate compared to fatalities and we don’t see the same pattern as in Pennsylvania:
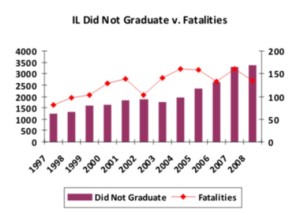
IL Did not graduate v fatalities

If there is any relationship between fatalities and training—which is uncertain—it would seem to be much closer between those who passed the course and fatalities than those who did not:
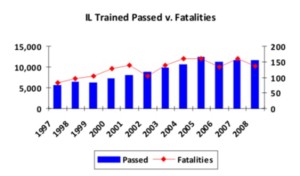
IL Passed v fatalities

This is not to say there are any relationships at all. It does suggest, once again, more study is called for.

For example, the percentages—overall—between the percentage of those who were passed or failed prior to the BRC and afterwards didn’t change all that much—however, just as in Pennsylvania, when Passed and Did Not Graduate are separated and compared to fatalities—there is a big difference and there’s a difference between the state that has a very low fail rate since 2002 and prides itself on telling its instructors not to be gatekeepers and encourage students to drop the course and the state that kept the same drop rate and ended up raising it’s fail rate towards the end and lowering its pass rate. Are these coincidences? I have no idea whether any of this means anything.

But there’s other interesting dimensions to Illinois’ fatality picture—more in the next entry.
Looking at Idaho

May 15, 2009

We looked at Pennsylvania in terms of common reasons people believe the death toll has gone up. Now we move on to Idaho.

Idaho is a small state—it’s entire population is just over 1.5 million. It also only began its state training program in 1996. Small changes in registration, training and fatality numbers, then, can make huge differences in percentages. In these ways, it’s not a good comparison to Pennsylvania.

Otoh, it provides a good comparison to Pennsylvania because it taught the MRC:RSS in the classroom until 2006 and then used TEAM Oregon’s BRT, and the RSS range until 2007 when it switched to the BRT range. This then does not give us enough passage of time to see if there was any change with the BRT. Otoh, it gives us one point of comparison on the effect of a curriculum and/or the state program administration:

Motorcycle registration

In 1997, motorcycle registrations were 34,935 and in 2007 they had increased by 9,012 to 43,947 or a 25.8% increase. In four out of the 11 years, however registrations decreased and rebounded. However, two of those decreases were in the past two years—the high for Idaho motorcycle registration, then, was in 2005 with 56,402.

Helmets

Idaho does not require a helmet for those 18 and older—this was the law before the training program began and is still the law.

Training

The state program began in 1996 so we do know exactly how many students were trained prior to 1997—264—although we don’t know how many riders were trained in other states.

Training went up 661.7% from 1996 to 2007. If 2008 is included, it went up 815.5%. But remember the curse of small numbers resulting in large percentages. At the end of the 2007, a total of 14,456 had taken basic training. If we assume all students went out and bought a bike and rode it, then just over 38% of Idaho’s riders were trained by the end of 2007.

Idaho is one of the very few states that actually found out how students performed on the road after graduating and so we don’t need to try to figure it out in other ways. One caveat—the numbers include those who took the basic and experienced rider courses and its impossible to differentiate:

Fatalities

From 1997-2007, fatalities went up 61.11%, which is to say it rose from 18 to 29 with a grand total of 204. However, in four of those years, fatalities were equal to or less than 18.

Before we get into the specifics, let’s look at Idaho’s training picture:

ear

Fatalities

Total Basic Training Students

Passed

Failed

Dropped

Did Not Graduate

1997

18

620

84.80%

8.20%

6.90%

15.10%

1998

6

544

88.70%

5.69%

5.14%

10.83%

1999

13

839

85.22%

9.17%

5.60%

14.77%

2000

18

1003

87.53%

5.78%

6.67%

12.45%

2001

19

1129

85.29%

8.59%

6.11%

14.70%

2002

12

1265

84.55%

7.74%

7.58%

15.32%

2003

19

1431

84.06%

8.31%

7.54%

15.85%

2004

24

1681

87.44%

7.37%

5.17%

12.54%

2005

26

1929

85.58%

7.87%

6.48%

14.35%

2006

38

1740

81.95%

10.63%

7.41%

18.04%

2007

29

2011

87.41%

8.50%

4.07%

12.58%

In Pennsylvania, the percentage of students that passed rose when the BRC began statewide in 2002 but the dramatic change was in the fail rate, which dropped to single digits. In contrast, Idaho’s percentages are consistent in all four areas (passed, failed, dropped and the combined “did not graduate”). Like Pennsylvania, the fail rate was in the single digits but unlike that state, in Idaho it was so in all but one year. However, Idaho’s averaged fail rate is 7.99% and Pennsylvania’s averaged BRC fail rate was 5.58%, and Idaho’s combined “did not graduate” and is slightly higher than Pennsylvania’s as well.

In Pennsylvania, there were two fatalities and one resulting in complete paraplegia from crashes in training, during this time. And, according to the state coordinator, there were incidents when bystanders were hit as well as students hitting sheds, cars and motorcycles off-range.

In Idaho, there have been no such incidents.

It is unknown if trained motorcyclists ride more or less or the same amount as untrained riders—or how many trained motorcyclists went on to ride at all after passing the course—or how many of those that did not graduate went on to ride.

Fatalities

From 1996-2007, only 22 students (10.78%) trained in Idaho were killed in a motorcycle crash.

When it comes to kind of crashes, 68% of trained students were killed in multi-vehicle crashes (MVC) and 32% in single-vehicle crashes. In comparison, 43% of untrained riders died in MVCs and 57% died in SVCs.

Impaired (alcohol/drugs) fatalities were 31.37% of the total. Trained rider fatalities comprised 4.69% of that total and  95.31% were untrained.

Just over 54% of trained rider fatalities were wearing helmets while almost 81% of untrained rider fatalities were helmeted.

When it comes to injury crashes, trained riders were also about the same percentages.

In 2004, the Idaho STAR program hired Bill Bohley, past NHTSA Associate Administrator for Research and Development to analyze the crashes from 1996-2003 and it was redone in 2007. The analysis included ERC students and assumed that all students owned a motorcycle and all riders—trained and untrained—rode the same amount. Based on those rather dubious assumptions and some simple calculations, the analysis concluded, “…training is associated with of reduced crash risk of 71%…and… an 81.4% reduction in the risk of a fatal crash”.

Because we know more than we did in Pennsylvania, there’s no need for the training vs. fatalities graphs.

Motorcycle Registrations v. fatalities

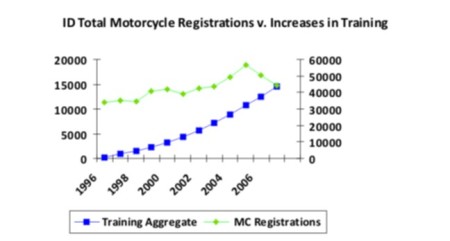
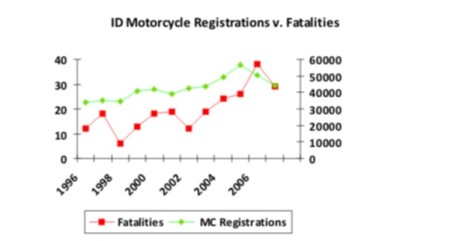
When it comes to motorcycle registrations, we find the same thing as we did in Pennsylvania—there appears to be little or no correspondence:

ID Motorcycle Registrations v. Fatalities

On the surface it appears there’s even less correspondence between training and motorcycle registrations in Idaho:

ID MC Registrations v. Aggregate Training

But it’s worth looking a little deeper: If we assume that each motorcycle represents one owner and all students end up buying motorcycles as Bohley did, then in 1996, 33,646 motorcycles were owned by untrained (or not trained in Idaho) riders.

If we compare the untrained riders in 1996 to the number of untrained riders in 2007 then that number falls to 29,491 (-12.3%). We don’t know if that represents people who stopped riding for one reason or another or if some of them took training.

In 1996, only 0.77% of motorcycle registrations represented trained riders,  but by 2007, the aggregate of trained riders had increased to just under 33%. But if we compare the aggregate of trained riders to the original number of registered motorcycles, it’s just over 52%.

The hidden number, though, is that only 4,155 (9.45%) of the 2007 motorcycle registrations are not accounted for by the (estimated) original and untrained owners and the aggregate of trained students. It could be, then, that only 19% of Idahoan motorcyclists registered a motorcycle and had not taken training at some point.

We don’t know if Bohley was correct in his assumption—other research, including Billheimer, suggests that 5% of trained students choose not to ride after the course and research suggests that trained new riders don’t ride as much as more experienced riders. Additionally, it’s reasonable to assume that many owners bought an additional motorcycle during those years.

While leaving mileage—and therefore exposure out of it—we can adjust for Bohley’s other assumptions: If Billheimer’s 5% do not ride and MIC’s owner to motorcycle formula is applied, trained riders represent 57.4% of all owners.

This strengthens the suggestion that training has become a normative part of buying and owning a motorcycle in the past 11 years.

Depending when those 22 fatalities occurred—and that information I don’t have—the success of the Idaho STAR program may be greater than Bohley’s analysis suggested. Otoh, it might not.  More study is needed.

Helmet use

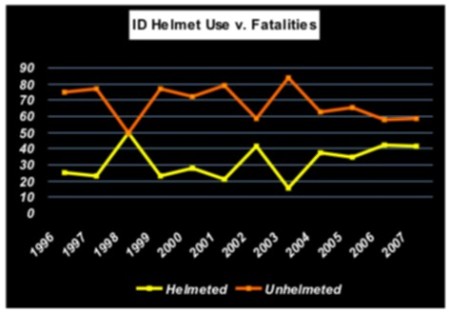
Idaho doesn’t require helmet use for riders 18 and older. The number of riders killed wearing a helmet has been trending up in the past four years while the percentage of unhelmeted fatalities is decreasing. NOPUS surveys have found helmet use increasing in western states and the Idaho DOT reported that in 2005, 64% of riders involved in collisions were wearing helmets. However, Idaho STAR’s analysis states only 38.2% of all collision-involved riders were wearing helmets.

ID Helmet use v. fatalities

Conclusion

Idaho STAR is to be praised for collecting the kind of data every program should. That effort was initiated and the first analysis was done under Ron Shepherd’s leadership and has been continued under his successor, Stacey (Ax) Axemaker.

It’s not enough to draw any conclusions about the efficacy of training—there’s too many assumptions that have to be made and it also depends on other unknowns. For example, it comes back to the self-selecting process: do those who tend to greater safety efforts and caution choose training and helmets? Or does training change minds so they ride safer and wear helmets?

And it should be pointed out that, in lieu of needed information, the Pennsylvania data at this point shows that training went up at about the same rate as fatalities. Idaho’s statistics do show there are differences—and there are similarities. It’s unknown if any are significant. So we’ll look at some other states and see if a clearer picture emerges.

Pennsylvania, A Tale of One State: The Helmet Effect

May 12, 2009

Once again and before we start, here’s my position on helmets: I wear, by choice, a full-face helmet and believe should be a matter of personal choice. I also will not write one word to help repeal or reinstitute a helmet law. The following, then, is not in support in one position or another and should not be taken as such.

The repeal of the helmet law would seem to be a likely culprit to the 142.7% increase in motorcycle fatalities—so let’s see what effect it really had:

The bill was signed into law in 2003, and that year, the state motorcycle fatality rate increased by 16.9%. Which seems to prove everything advocates say about helmet laws.

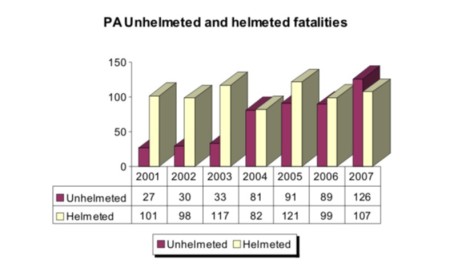
However, in 2003, only 3 more unhelmeted riders were killed in 2003 than in 2002—or a 10% increase. That might surprise you that I use the words “more” and “increase”—but, as you’ll see in the chart below, riders were killed without helmets before the law was passed. So, if there’s a helmet effect, there was already a small degree of that operating in Pennsylvania.

Three additional unhelmeted deaths, though, didn’t really affect the fatality rate in Pennsylvania in 2003. Some would suggest that there were only three because the bill was signed in September and it was almost the end of the riding season. But that’s to minimize that huge jump in the fatality rate—and it was among helmeted riders who had a 19.38% increase—or almost twice the increase than among unhelmeted fatalities.

PA unhelmeted and helmetd deaths

Then came 2004—the first full season where riders could go helmetless as long as they had either two years of experience or passed a training course.

In 2004, the number of unhelmeted deaths increased 145% which is a huge immediate increase. It translates into 48 more riders than the previous year died sans lid. It seems to be a big Aha! Moment for the helmet people.

Logically, some increase would be expected simply because so many more riders were going helmetless. The question is whether helmetless riders were contributing more than their proportion of the riding population. Research claims that helmet use decreased to 58% in Pennsylvania—and in 2004, unhelmeted riders were 49.7% of the fatalities—so they were contributing more than their share of fatalities.

What’s odd though is that overall fatalities only went up 2.5%—only four more riders total were killed in 2004 than in 2003. Hardly the bloodbath on the beltway we were led to believe would happen.

In actuality, 48 more riders died while not wearing a helmet but 35 fewer helmeted riders died.

But that’s not all that was extraordinary about 2004 in Pennsylvania: It was also the year of the single largest increase in motorcycle registrations with over 41,000 additional motorcycles being registered that year. The figure is all the more extraordinary because the prior year saw an increase of just over 1,200 bikes and the following year, 2005, the increase was just over 13,600 motorcycles. So 2004 was remarkable for more than just no more helmet head.

Iow, there was a full year of helmetless riding when tens of thousands of motorcycles  and 18,699 riders took the basic course and were added to the road mix. It should’ve been the year of living dangerously and instead fatalities only went up 4 riders—2.5%—over the previous year.

And while some years experienced a decline in fatalities, 2004 was the smallest increase in the timeframe from 1998-2007.

The helmet law had an effect but it didn’t necessarily mean that more riders died than had the helmet law not been repealed. And it’s also suggestive that the relationship between increased motorcycle registration and fatalities is not so simple or clear-cut as we have been led to believe.

2005 was stranger still: unhelmeted fatalities increased by 12.34% (10) but helmeted fatalities increased 47.5% (39) and overall fatalities increased by 30% while motorcycle registrations only increased by 4.7%.

And an even stranger thing happened the next year: In 2006, motorcycle registrations went up 8.2% but overall fatalities experienced a decrease of 11.3% However, helmeted riders saw a bigger decrease than unhelmeted ones.

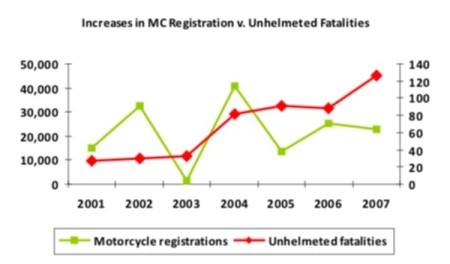
Only when the helmet law was five years old in 2007 did the statistics match up to the picture we have been led to believe is the norm: motorcycle registrations went up 7% and 19 more unhelmeted riders than helmeted ones died and the overall fatality rate increased by 23.9%. Iow, only 2007 shows the kind of correlations we have been led to believe is the norm.

PA regs v. unhelmeted fatalities

The relationships between helmet use and fatalities, motorcycle registration and fatalities does not seem to be as simple or straight forward as we’ve been led to believe. None of this is to suggest that riders who may have lived die instead because they weren’t wearing a helmet.

Otoh, it seems to strengthen the belief that repealing universal helmet laws increases motorcycle sales–at least temporarily.

Training to ride helmetless

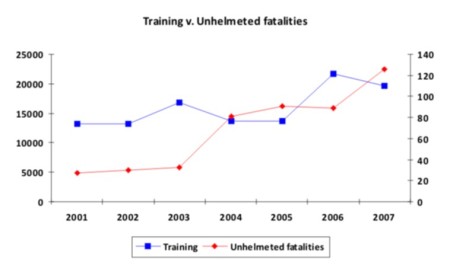
There appears to be another effect, however—training, which is believed to lower the risk of riding, appears to be correlated with non-helmet use—which is believed to increase that risk.

Training had been generally increasing since 1997 with the biggest jump in 2000 with an 11% increase—but then training actually decreased 5.2% in 2001 and stayed almost exactly the same in 2002.

Training numbers increased as the law moved through the legislature and to the Governor’s desk and continued to grow. Training grew 28% in 2003, another 11% in 2004, stayed at that level in 2005 and increased another 16% in 2006 even as motorcycle registration growth slowed down. Training decreased in 2007.

This suggests that the significant increase in training appears to be correlated with riders who went out and bought a bike because they now could ride without a helmet if they got training. But did training act as the antidote to riding without a helmet?

PA training v. unhelmetd fatalities

Now that we’re more than two years past the helmet law repeal the only way someone can begin to ride without a helmet is by taking training. So any new (≤2 years) unhelmeted rider fatality has gone through training—if they are licensed, that is. It’s unknown how many of the fatalities–trained or untrained–were trained or untrained. The relationship between training and fatalities and training and unhelmeted fatalities and what it might say about the quality and effectiveness of training should be explored.

56% (95,618) of all the students have been trained and 56% (955) of the fatalities have all occurred since the helmet law was passed. It’s unlikely that all riders who died were trained. But it’s equally unlikely that they were all untrained.

The increase in motorcycle registrations since the helmet law has been repealed is 61% (103,983).

It also should be noted that the motorcycle manufacturers not only control the course curriculum and licensing standards but the administration of the training program in Pennsylvania and benefit financially from the increased sale of motorcycles and accessories.

The question is whether other states show similiar evocative patterns. And we’ll get to that soon.

A Closer look at PA’s training picture

May 8, 2009

I decided to figure the training statistics a different way to get a different—and hopefully clearer picture of a decade long training picture in Pennsylvania. I’m working on similar snapshots in other states but figured I’d put this up now to hopefully resolve some of the oddities in the other entry. I wish I had the data from a couple more years before ’97 but I don’t have access to that.

I’m giving you all the information first. In 2001, both the MRC:RSS and BRC were taught in PA, the fatalities number, though, applies to both—it’s not 138 RSS and 138 BRC. “Did not graduate” is the total of failed and dropped percentages.

Year MC fatalities Total Students Passed Failed Dropped Did not graduate

1997

96

10,569

69.7%

N/A

N/A

30.28%

1998

115

11,607

69.3%

14.90%

12.8%

27.7%

1999

113

(est: 12,500)

N/A

N/A

N/A

N/A

2000

156

13,873

75%

13.80%

11%

24.8%

RSS2001

138

9,464

73.50%

26.40%

N/A

26.4%

BRC2001

(138)

5,147

82.40%

17.50%

N/A

17.5%

2002

136

15,993

82%

6%

11.70%

17.7%

2003

159

20,273

83%

5.80%

11.10%

16.9%

2004

163

22,327

83.70%

5.20%

10.90%

16.1%

2005

212

22,327

83.70%

5.20%

9.50%

15%

2006

188

25,567

84.80%

5.50%

9.50%

15%

2007

233

23,308

84.40%

5.50%

9.90%

15%

From 1997-2007, a total of 192,955 students received at least some training in the Pennsylvania Motorcycle Safety Program.  Just over 40% were trained from 1997-2002 and 58.9% from 2003-2007.

Looking at the data, there’s an obvious change beginning in 2002 (and in the pass rate for BRC students in 2001) in terms of both pass and failure rate. While the pass rate rose–it’s the fail rate that has a stunning change–and the cummulative did-not-successfully graduate rate.

However, it could be that the BRC is, as MSF claims, better at training students than the MRC:RSS. So we’ll look more closely at the data and then compare it to the fatality rate.

Enormous increase in Pass rate:

The total pass rate for the 11 years was 88.3%–but more passed in the BRC years than in MRC:RSS years. The Pass rate rose from a low of 69.3 in 1998–the first year fatalities began to rise–to 84.8–the year before the highest death toll. That’s an 81.7% change–and that’s significant in anyone’s analysis.

95,618 students passed from 2003-2007 or 56% of all who passed the course did so in a 4 year span of time (36%).

Thousands more, then, passed the course than may have under the MRC:RSS.

Changes in Fail Rate

As interesting as the pass rate is, the failure one is even more intriguing: If one considers the 26.5% failure rate of the MRC:RSS students in the switch year as an anomaly and average the other three years, it’s a 15.4% fail rate. Averaging the fail rates for the BRC, it’s 5.58%.

17,154 students failed from 1998-2007, but 64% of them failed from 1999-2002 . That’s a 68.5% difference between the MRC:RSS and the BRC and with the change in the pass rate.

Whether the BRC is easier to pass, these results suggest it’s much harder to fail the course. Or perhaps those taking the course are of much higher quality and capability than those who used to take the course–something instructors and rider educators would strongly disagree with.

The drop rate also changed–but there’s just not enough pre-BRC data to do more than observe that it may have dropped up to 1/3–meaning more students remain until they pass or fail.

Training v. Fatalities?

The claim MSF and rider educators make is that training is effective in making riders safer in traffic. Fatalities are rare compared to injuries–which happen in almost every crash. Fatalities then are the tip of the tip of the crash iceberg. However, they are also the worst case scenario.

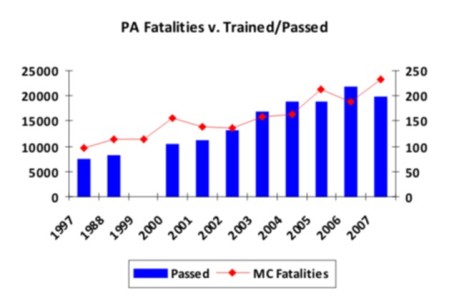
It’s also believed that those who pass the course are at least more skilled than those who drop or fail or were untrained. So how does the pass rate line up to the fatality rate? Note: I combined the RSS and BRC numbers for a total number for 2001.

PA Fatalities v. Trained Passed

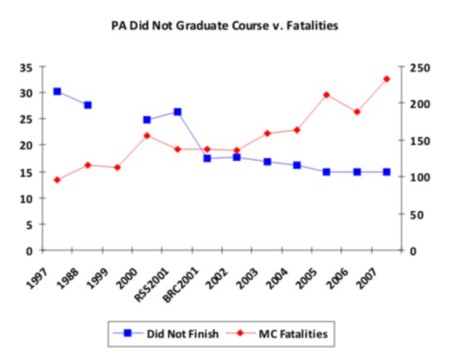
Then I graphed the total percentages of both Failed and Dropped against fatalities:

PA Did Not Finish v. Fatalities

As the Failed and Dropped out percentages dropped, the fatality rate rose and a classic graph pattern results.

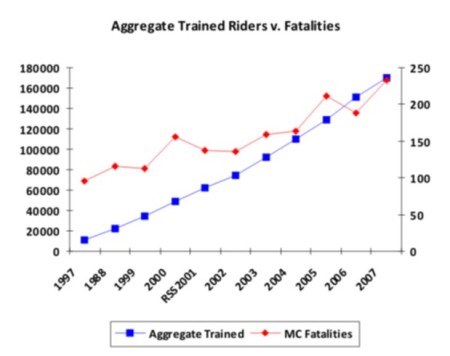
Let’s look at it from the aggregate of all riders who passed the course:

PA Aggregate Trained Riders

In all these ways there appears to be a counterintuitive result. In fact, the higher the number of trained riders, the more fatalities there seem to be rather than less.

Rider educators regularly say that some training is better than no training and it’s better for the rider to keep them in the class as long as possible. So it’s of particular note that lower failure/drop rates results in higher fatality rates.

On this surface examination, then, training does not seem to be doing what MSF has led us to believe it does–at least not in Pennsylvania.

Of course, we have no idea who these fatalities are and how many were trained or not and though it appears there may be some suggestive patterns may not be correlations in fact. What this does suggest is that more study–and study by those who are not financially beholden to MSF–is needed.

However, there was that huge increase in motorcycle registrations—and riders have long believed that the death toll is positively correlated to registrations so let’s compare the increase in fatality rate against the increases in motorcycle registration:

PA increased fatalities v registrations

It does not appear that there’s a relationship there. However, there’s always the change in the helmet law—and that’s the next entry.

A Tale of One State: Pennsylvania

May 7, 2009

Given the latest entry, I’m going to have to tweak this one–it’ll be back up tonight or tomorrow. Sorry for any inconvenience.

This is what I’m talking about

May 5, 2009

On Saturday at about 5:30 p.m. 56 year-old Anita Zaffke was on her way home and sitting at a stop light on her Honda Shadow at a light at Old McHenry Road on Rte. 12 in Lake Zurich, IL. It’s a four-lane divided highway. She was wearing a reflective jacket and a helmet, according to this article on the Chicago CBS site.

Neither jacket nor helmet helped her, though, when 48 year-old Lora Hunt driving an Impala rammed into the back of Zaffke’s bike. Hunt had been painting her nails and admitted she wasn’t paying attention and didn’t see the bike or the stop light.

Zaffke’s bike was hit so hard she and the bike flew 200 feet down the road. Her spine was fractured and she died an hour later in the hospital of multiple chest and abominal injuries.

Hunt got a ticket for failing to reduce speed to avoid a crash. It’s a misdemeanor.

This crash got me thinking of how three riders–including Jeff Brenton who teaches in the NIU region of the Illinois Motorycle Rider Program, iirc–all were hot to stress how it’s the rider’s responsibility to ride safe. And I’m sure that some riders would find fault with Zaffke and suggest she should’ve done this or should’ve done that. And maybe she could’ve, I don’t know. The fact remains, Hunt was painting her fingernails and had she been paying attention, Zaffke wouldn’t have been hit.

So this press release out of Tennessee is what I think motorcycle rights activists wanted Motorcycle Awareness Month to do. It equally addresses the issues and problems for both other road users and riders:

TDOS Joins Agencies to Urge Drivers & Riders to “Share the Road”

May is Motorcycle Safety Awareness Month & National Bicycle Month

NASHVILLE — The Tennessee Department of Safety has teamed up with the Governor’s Highway Safety Office, the Motorcycle Awareness Foundation of Tennessee, the Tennessee Truckers Association, the Nashville Area Metropolitan Planning Organization (MPO), Walk/Bike Nashville and the Murfreesboro Police Department to encourage motorcycle riders, bicyclists and drivers to “Share the Road.” May is Motorcycle Safety Awareness Month and National Bicycle Month, and to kick it off, the agencies hosted a safety festival Saturday, May 2, 2009, at Bumpus Harley Davidson in Murfreesboro, Tennessee.

“As the weather improves, more and more motorcyclists and bicyclists are hitting the roads. With that in mind, drivers of all vehicles need to be extra attentive and make sure they “Share the Road,’” said Department of Safety Commissioner Dave Mitchell. “Motorcycles and bicycles are some of the smallest vehicles on our roads, often hidden in a vehicle’s blind spot, so everyone needs to really look out for them.”

Motorcycle fatalities nationwide have steadily increased over the past decade. In Tennessee, the number of motorcyclists killed in crashes jumped from 42 in 1998 to 143 in 2008. Statistics for 2000-2008 and a list of Motorcycle Safety Tips are attached to this release.

“This steady increase over the past decade represents one of our greatest highway safety challenges,” said Governor’s Highway Safety Office Director Kendell Poole. “When you consider that one out of every seven deadly crashes last year involved a motorcycle rider, it is clear that drivers need to be extra cautious.”

Motorcyclists and bicyclists have responsibilities too. Riders must follow the rules of the road and always wear protective gear.   More than 300,000 Tennesseans are licensed to operate motorcycles. Tennessee law requires that they, and their passengers, wear approved helmets and protective eyewear.

“Motorcyclists must understand that riding a motorcycle is different than driving a car,” said John Milliken, the state coordinator of Tennessee’s Motorcycle Rider Education Program. “Motorcyclists are much more vulnerable than passenger vehicle occupants in the event of a crash. It is imperative that they educate themselves by taking an accredited training course and never ride beyond their skill ability.”

The Department of Safety’s Motorcycle Rider Education Program approves courses and instructors across the state. To find out more about the program, go to: http://tennessee.gov/safety/mrep.htm.

The mission of the Motorcycle Awareness Foundation of Tennessee (MAFT) is to remind drivers to stay alert for the less visible motorcycles on the roadways. “More than half of all motorcycle crashes involve another vehicle, so all drivers must be aware of motorcyclists,” stated MAFT State Coordinator, Bob Edwards. “We also want to remind riders that they should always ride defensively and within their own limits.”  To find out more information about the MAFT, go to www.maft.us.

At the event, the Tennessee Truckers Association set up its “No Zone” truck to illustrate the importance of being visible while riding or driving near tractor-trailers. TDOS set up a safety course for motorcyclists, and many of them participated in a ride Saturday afternoon from Bumpus Harley Davidson to Lynchburg, TN.

The Tennessee Department of Safety’s mission is (www.tennessee.gov/safety) to ensure the safety and general welfare of the public. The department encompasses the Tennessee Highway Patrol, Office of Homeland Security and Driver License Services. General areas of responsibility include law enforcement, safety education, motorist services and terrorism prevention.


st1\:*{behavior:url(#ieooui) }
<!– /* Font Definitions */ @font-face {font-family:SimSun; panose-1:2 1 6 0 3 1 1 1 1 1; mso-font-alt:宋体; mso-font-charset:134; mso-generic-font-family:auto; mso-font-pitch:variable; mso-font-signature:3 680460288 22 0 262145 0;} @font-face {font-family:Verdana; panose-1:2 11 6 4 3 5 4 4 2 4; mso-font-charset:0; mso-generic-font-family:swiss; mso-font-pitch:variable; mso-font-signature:-1593833729 1073750107 16 0 415 0;} @font-face {font-family:”\@SimSun”; panose-1:2 1 6 0 3 1 1 1 1 1; mso-font-charset:134; mso-generic-font-family:auto; mso-font-pitch:variable; mso-font-signature:3 680460288 22 0 262145 0;} /* Style Definitions */ p.MsoNormal, li.MsoNormal, div.MsoNormal {mso-style-parent:””; margin:0in; margin-bottom:.0001pt; mso-pagination:widow-orphan; font-size:12.0pt; font-family:”Times New Roman”; mso-fareast-font-family:SimSun;} @page Section1 {size:8.5in 11.0in; margin:1.0in 1.25in 1.0in 1.25in; mso-header-margin:.5in; mso-footer-margin:.5in; mso-paper-source:0;} div.Section1 {page:Section1;} –>
/* Style Definitions */
table.MsoNormalTable
{mso-style-name:”Table Normal”;
mso-tstyle-rowband-size:0;
mso-tstyle-colband-size:0;
mso-style-noshow:yes;
mso-style-parent:””;
mso-padding-alt:0in 5.4pt 0in 5.4pt;
mso-para-margin:0in;
mso-para-margin-bottom:.0001pt;
mso-pagination:widow-orphan;
font-size:10.0pt;
font-family:”Times New Roman”;}

This press release out of Tennessee is what I think motorcycle rights activists wanted Motorcycle Awareness Month to do. It equally addresses the issues and problems for both other road users and riders:


st1\:*{behavior:url(#ieooui) }
<!– /* Font Definitions */ @font-face {font-family:SimSun; panose-1:2 1 6 0 3 1 1 1 1 1; mso-font-alt:宋体; mso-font-charset:134; mso-generic-font-family:auto; mso-font-pitch:variable; mso-font-signature:3 680460288 22 0 262145 0;} @font-face {font-family:Verdana; panose-1:2 11 6 4 3 5 4 4 2 4; mso-font-charset:0; mso-generic-font-family:swiss; mso-font-pitch:variable; mso-font-signature:-1593833729 1073750107 16 0 415 0;} @font-face {font-family:”\@SimSun”; panose-1:2 1 6 0 3 1 1 1 1 1; mso-font-charset:134; mso-generic-font-family:auto; mso-font-pitch:variable; mso-font-signature:3 680460288 22 0 262145 0;} /* Style Definitions */ p.MsoNormal, li.MsoNormal, div.MsoNormal {mso-style-parent:””; margin:0in; margin-bottom:.0001pt; mso-pagination:widow-orphan; font-size:12.0pt; font-family:”Times New Roman”; mso-fareast-font-family:SimSun;} @page Section1 {size:8.5in 11.0in; margin:1.0in 1.25in 1.0in 1.25in; mso-header-margin:.5in; mso-footer-margin:.5in; mso-paper-source:0;} div.Section1 {page:Section1;} –>
/* Style Definitions */
table.MsoNormalTable
{mso-style-name:”Table Normal”;
mso-tstyle-rowband-size:0;
mso-tstyle-colband-size:0;
mso-style-noshow:yes;
mso-style-parent:””;
mso-padding-alt:0in 5.4pt 0in 5.4pt;
mso-para-margin:0in;
mso-para-margin-bottom:.0001pt;
mso-pagination:widow-orphan;
font-size:10.0pt;
font-family:”Times New Roman”;}

This press release out of Tennessee is what I think motorcycle rights activists wanted Motorcycle Awareness Month to do. It equally addresses the issues and problems for both other road users and riders:

This press release out of Tennessee is what I think motorcycle rights activists wanted Motorcycle Awareness Month to do. It equally addresses the issues and problems for both other road users and riders:

This press release out of Tennessee is what I think motorcycle rights activists wanted Motorcycle Awareness Month to do. It equally addresses the issues and problems for both other road users and riders:

is press release out of Tennessee is what I think motorcycle rights activists wanted Motorcycle Awareness Month to do. It equally addresses the issues and problems for both other road users and riders:

Motorcycle Awareness Month–same old, same old

May 1, 2009

And once again, too much of the coverage makes it appear it’s our fault. Here’s one story “CHP launches new safety campaign”that aired on the LA ABC station yesterday.

Though it’s supposedly about the CHP, it’s the Motorcycle Safety Foundation’s views that dominates the clip and MSF’s Rob Gladden that does most of the talking—and expostulates MSF’s views:

For example, he says, “Because people who are either self-taught or taught by friends and family are over-represented in crash statistics year after year.” However, there’s absolutely no evidence that this is true—and abundant evidence that MSF’s brand of training isn’t effective and increases a rider’s risk of crashing.

The reporter brings up wearing protective gear at all times and then goes on to say, “Notice that these students in a safety class are covered head to toe. Warm weather might make a ride to the beach inviting but taking a spill in things like shorts and flip-flops could mean a painful trip to the ER.”

However, what students are required to wear in “safety classes” would do virtually no better at preventing that trip to the ER. Only over-the-ankle boots and full-fingered gloves would be better at preventing injuries than the long-sleeve shirt and long pants required for class and the shorts and t-shirt cited in the story.

That the reporter mentions “protective gear” and “safety classes” and shows what the students are wearing smakes it appear that clothes that would last less than a few seconds in a fall are both safe and protective–when they aren’t.

Otoh, one thing that year after year has been found to be true: over half of all riders die in multi-vehicle collisions and, in a preponderance of cases, it’s the driver and not the rider who is at-fault. But, as in other years, MSF gives short shrift to what drivers should do. The reporter says, “And since everyone needs to share the road safety experts have tips for drivers as well. This is all Gladden had to say about them, “If you’re startled by a motorcycle coming up upon you, chances are it’s been approaching for several seconds. So use those mirrors and pay attention to motorcycles, look for them,” said Gladden.

This almost all the CHP had to say about motorcycle awareness: the reporter says, “Nice weather in Southern California and motorcyclists on the road are almost a foregone conclusion, but crashes don’t have to be” and the shot cuts to CHP Commissioner Farrow, “They can be prevented. With proper equipment, proper training, and proper rules of the road, following those rules, I think we’ll be okay.”

It sounds far too much like it’s the motorcyclist’s fault if they aren’t ok.

Texas mandatory training bill specifically targets sport bike riders

May 1, 2009

According to “’High-performance’ bill focuses on motorcyclists” on the elpasotimesonline.com site, Texas joins North Carolina and Missouri with a mandatory helmet law up before its legislature this year. The Lone Star state has a particularly diabolical one, however—and a pretty damn near useless one as well.

Texas, if you recall, is one of the four states where MSF is establishing a regional “campus”. And, apropos of nothing, Texas has 20 Rider’s Edge sites as well.

The bill would require training for all who buys or operates a “high performance” motorcycle on or after September 1, 2009. The law would only apply to those particular kind of motorcycles.

The article doesn’t really define what a ‘high-performance’ motorcycle is—for that you have to go to the bill text: “”High-performance motorcycle” means any motorcycle referred to, called, labeled, or described as a “sports bike”, “sports motorcycle”, “high performance motorcycle”, or other similar term, in any materials given to an original purchaser at the time of purchase from any dealership or retail seller of such motorcycle, or contained in the owners manual or guides from the manufacturer of such motorcycle, whether or not actually delivered to the purchaser.”

Iow, those who ride street bikes, sport-tourers, touring bikes, adventure, dual-sport, cruisers or choppers aren’t required to take training.

And it applies to “all owners and operators” who buy or operate that specific kind of motorcycle on or after September 1, 2009. There’s no provision for the already licensed and no provision for age. There’s no grandfathering clause at all.

AND, they have to take that training within 180 days (6 mos)—

AND carry proof that they have taken training (and passed, I presume) with them at all times they are riding the motorcycle—

AND if they don’t, it’s not less than a $500 or more than a $1,000 fine.

The justification the article gives for the bill is that a 20 year-old, Myles Anderson, was killed in a crash “only weeks” after buying his motorcycle. But had this law been in effect, Anderson could still have been legally riding that bike for up to 6 mos—and therefore, this law wouldn’t have saved him.

If the law passes then it makes a legal judgment that a particular style of motorcycle is particularly dangerous.

Yet sport bike riders are far more likely to wear helmets and protective gear than street, cruiser or touring bike riders. Factors associated with safety and safe riding.

So why is this bill fairly useless (beyond the fact that NHTSA says that no study has found training to be effective in reducing crashes)? Because the article says that the Texas Department of Public safety 41,500 riders took the course and 7,000 got their licenses without taking training. Which suggests that about 86% already got their licenses through taking the learn-to-operate course offered in the state.

Iow, the vast majority of Texans already take training no matter what kind of motorcycle they ride. This law, then would only apply to that portion of the 14% that own or operate specifically sport bikes. Not to mention the grave injustice that those who already have their endorsement would have to take the course if they had the gall to ride someone’s sport bike or buy one of their own.

But let’s dig a little deeper here: According to what was submitted to the SMSA, 88% of BRC students passed the course in 2007. And that means that, according to Texas law, they don’t have to wear a helmet. When it comes to what we’re told makes us safer, the law giveth and the law taketh away…

So if more riders took training, more riders would be legally allowed not to wear helmets…

But helmets are held up as the most effective safety equipment there is—and are supposed to save so many lives…

Texas has the third highest rate of motorcycle deaths in the USAFlorida was first in 2007 and Texas barely trailed California. In Florida, 52% of the fatalities were helmeted and 48% weren’t.

But in Texas of 375 riders killed in 2007, 87% were, in fact, helmeted and only 13% weren’t.

Hmmmm…86% were trained in 2008 and 87% of the fatalities were helmeted. So the two things that are supposed to be THE panacea for all that ails us–doesn’t seem to be doing a very good job.

And the vast majority of Texan motorcyclists aren’t sport bike riders…

And the training bill would only affect the small proportion of that 14% that didn’t get training to get their license…

Not to mention that NHTSA says that they don’t even know what good or effective training would be and no study has shown that training is effective in reducing crashes. But they’re really big on helmets because they’re 37% effective for preventing death.

And now we’re back to Myles Anderson who bought a bike and was killed within a few weeks–and that’s so bad all of Texas needs a bill. As if no cruiser or chopper or touring bike or street bike rider had ever died within a few weeks of buying a bike–with or without training. So, without absolutely any proof that this would work–and if it passes would make it legal for graduates to ride without helmets–the good legislators in Texas are thinking about voting for this bill?

And they call California the land of fruits and nuts.